Feature Stories
A millennial-owned company
expands at warp speed By Lawrence Chou [stag_dropcap font_size=”100px” style=”normal”]W[/stag_dropcap]hen people talk about using “data” in
their print businesses, or being “data-driven,” it’s usually in connection with “variable-data printing” — using customer-supplied data to produce highly targeted personalized direct mail. That’s one use of data, but it’s not what I consider to be a true data-driven business,
January 21, 2019
A millennial-owned company expands at warp speed
By Lawrence Chou
[stag_dropcap font_size=”100px” style=”normal”]W[/stag_dropcap]hen people talk about using “data” in their print businesses, or being “data-driven,” it’s usually in connection with “variable-data printing” — using customer-supplied data to produce highly targeted personalized direct mail. That’s one use of data, but it’s not what I consider to be a true data-driven business, and it’s not how we use data.When I talk about MGX Copy being a “data-driven” business, I mean that we use data not from but about our customers to help us decide what products to offer and what kinds customers to pursue. And that we use data about our operations to guide virtually every decision we make about our company, from staffing and training to equipment purchasing to facility growth planning.
Nine years ago, I started MGX Copy in my parent’s garage, from basically nothing. Today, we’re a multimillion dollar company with two San Diego facilities and a third location in New Jersey. A big part of our success is due to our creative and consistent use of data.
And when I say that our first “location” was a garage, I mean that quite literally.
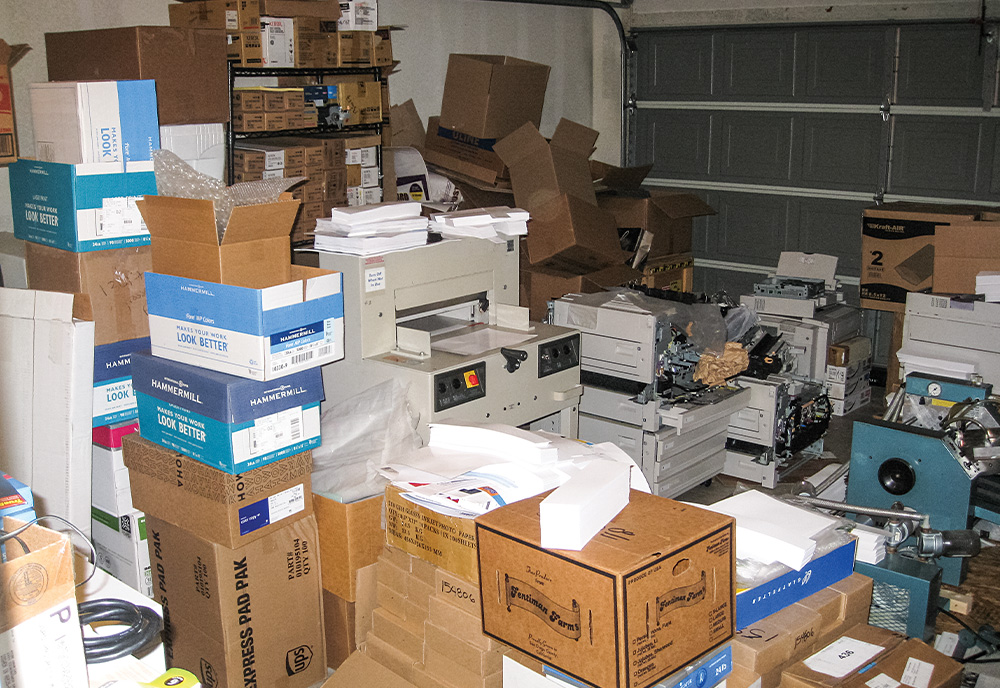
2010 – Humble beginnings in family garage. Staff: 3.
Print or the Laundry?
It was just a crazy idea at first: I needed to have something printed, and I found the particular experience to be compromised on just about every level — service, quality, price. I thought to myself, “I could run a better print business.” It was the kind of blue-sky idea you have when you’re young and fresh out of college (I had just graduated from UCLA). The idea stuck with me, so I recruited some friends and family to help me launch the business. We bought our first printer from a local electronics store. It cost $400 and sat on a desk in the garage. After the first year (and another printer), I had two family members and three friends working full-time.
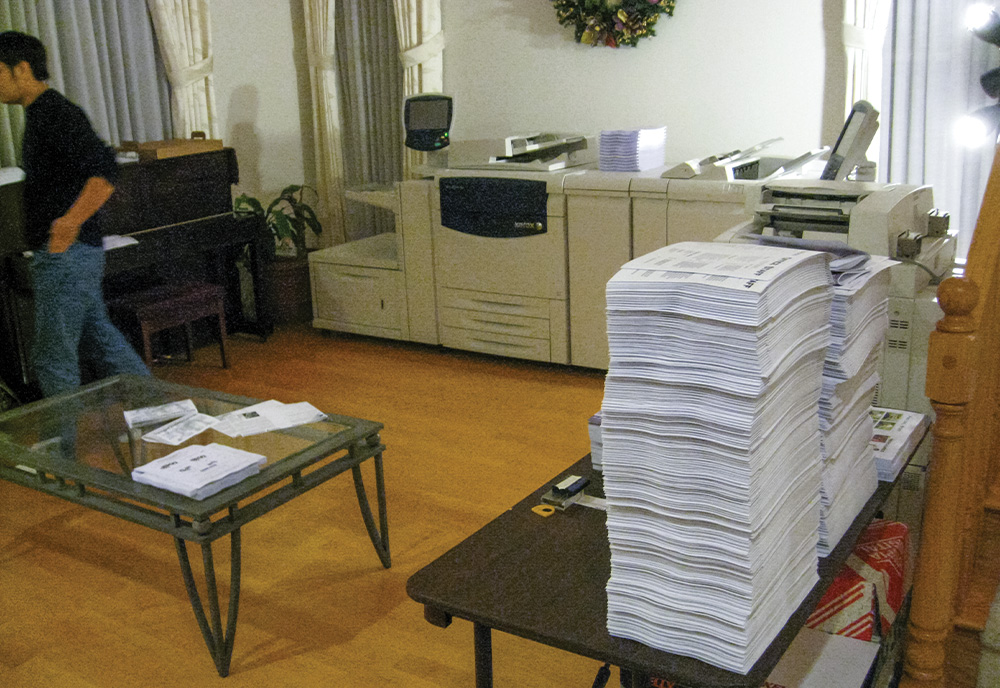
2011 – Expand into livingroom. Xerox 700 creates a choice: print or laundry?
We started advertising and taking orders online. Our first product was black-and-white copies, and we soon added color. Our early specialty was cheap color copies for a national audience, enabled by savvy Internet marketing and search engine optimization. That was it. That was also where the name MGX Copy came from: We made copies.
We stayed in my parents’ garage for as long as we could. As we expanded, the business spread to the dining room … and the living room … and my brother’s room … and my room. We had upgraded our desktop printer to a Xerox DocuColor 242, and we added a Xerox 700. Then we ran into problems. The 700 needed 220 volts of electricity, and residential homes usually have only one 220-volt outlet to run the dryer. So that’s where we plugged in the 700. We could either print or do laundry, but not both. Fortunately, my brother and father were part of the company at the time, and my parents were incredibly supportive — up to a point.
2012 – Move into first facility. Poway, CA. 2,400 sq. ft.
That came when there were stacks of paper all over the house, and the laundry wasn’t getting done. After about two years of this, my parents decided, “We’ve incubated you enough,” and they kicked us out. We moved into a facility in Poway, a suburb of San Diego. In about two years, we grew out of that facility and moved to a larger facility in San Diego. We grew out of that in two years, so we added a second facility in San Diego, and then added our New Jersey location.
Managing in Real Time
MGX Copy has been included in lists of the fastest-growing companies in America for the past four years. We’ve been named the 17th fastest-growing company in San Diego, and the 50th fastest-growing company in California. When you look at these kinds of lists, they include nearly all technology companies. You never see a printing company. The fact that we’ve registered on these lists is validation that taking a technology-based approach to a traditional business can reap rewards.
“MGX Copy has been included in lists of the fastest-growing companies in America for the past four years.”
We use data as a near real-time indicator of what we need to do with our business to react to our internal conditions — and to the market — quickly. We don’t wait 12 months for results and then try to figure out what happened in the past and how it impacts the delayed present. We can see the trends daily or weekly and make key decisions fast — about equipment, staff, and products.

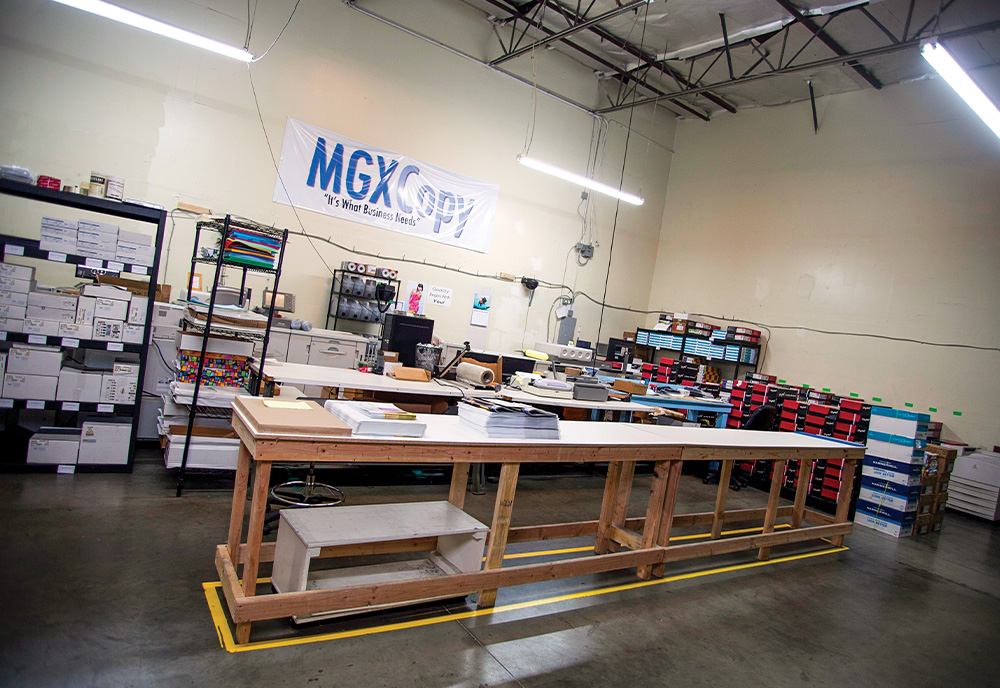
2014 – Move to large facility. San Diego. 7,500 sq. ft.
When we first launched MGX Copy, our biggest challenge was that we didn’t actually come from the printing industry. Neither I nor any of the friends, family, or college classmates who joined me had any experience running a print business. But that may well have been our biggest advantage.
I had been an economics major. And I brought in friends who were also economics majors — and software engineers — to help me get the business launched. While we didn’t have decades of printing industry experience or “gut instincts” to rely on, we did have computer programming and software engineering skills, as well as our ability to crunch numbers and recognize the value and potential uses of data. We brought that knowledge and overall approach to bear on the business.
Now, it’s one thing to collect data. Anyone can collect data. It’s another to act on it. Unless you use data to make informed decisions about your business, it’s just a collection of random numbers. I’ll share the four main steps we use in our approach to data analysis.
Determine the Data to Capture
Not everyone knows what types of data can be captured or that, depending on the software you have, you can capture data about virtually any aspect of your business.
For example, let’s take employees. We can determine who our best employee is, and by how much compared to other employees. We can determine if our best employees are improving and if we have any who need to improve. This kind of data helps us make decisions about compensation — who merits a raise and who doesn’t — and identifies those who may need more training. Ultimately, this leads to better employee morale and better overall productivity.
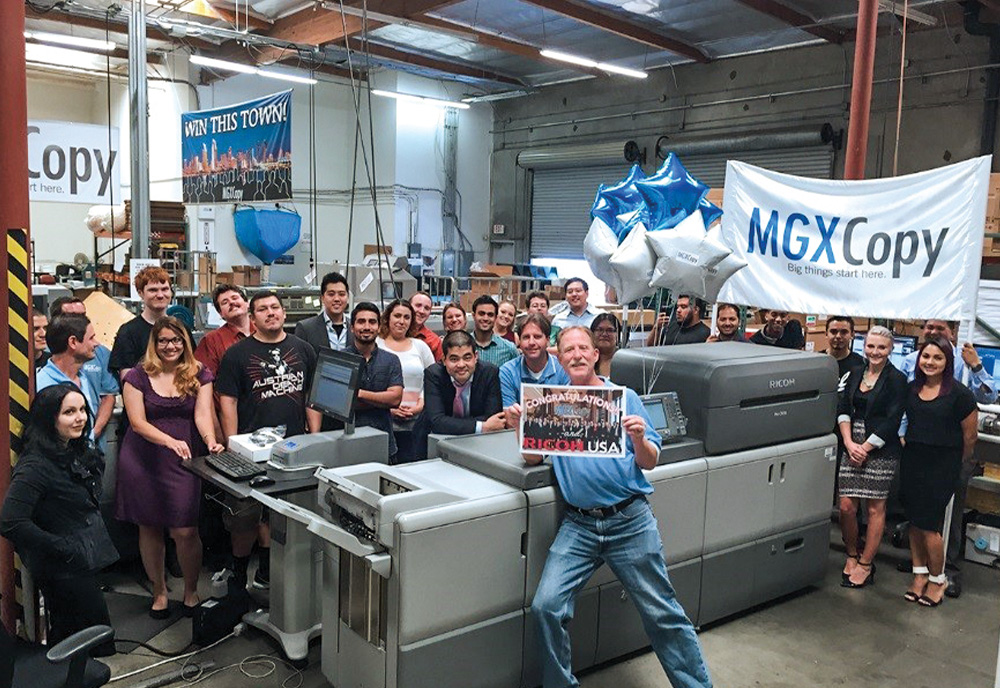
2015 – Install first Ricoh C9110 in the country.
Data can also relate to operations. We can see how much waste there is in the company and who or what equipment is most responsible for it. Any time we need to reprint a job, we document it. We identify the reason for the reprint and the operator and/or the machine that caused it. We can see immediately if we’re having a lot of issues with a particular operator or machine. Does the operator need more training? Does the machine need maintenance?
We use data to manage capacity. More than 95 percent of our jobs are shipped, and we have to expedite shipment at our own expense if we’re not making our deadlines. We track the kinds of jobs that aren’t getting out on time and can pinpoint where the bottlenecks are. Do we need to add staff? Do we need to add an additional shift? Do we need to increase capacity? Is there an issue in our bindery?
And data can relate to product offerings. We can identify our best-selling product and see if it’s on a growth trajectory. If so, we can decide whether to buy new equipment to capitalize on the trend. We can pinpoint our least-selling product, see whether it’s on a downward trend, and decide whether to remove it from our offerings. This data helps tailor a product mix that is most relevant to the current market.
Collect the Data
Data is really just the result of measurement. We measure every aspect of our company. And the tools we use vary depending on which part of the operation we’re measuring. We wrote and developed our own production and management workflow (MIS) to suite our business and data collection objectives. In addition to that, we use some off-the-shelf, third-party solutions and some simple forms and commonly available applications.
To analyze our print department, for example, we developed an electronic form that each press operator fills out to record his or her daily output in number of jobs and number of clicks. This allows us to measure each print operator’s performance and the performance of the equipment.
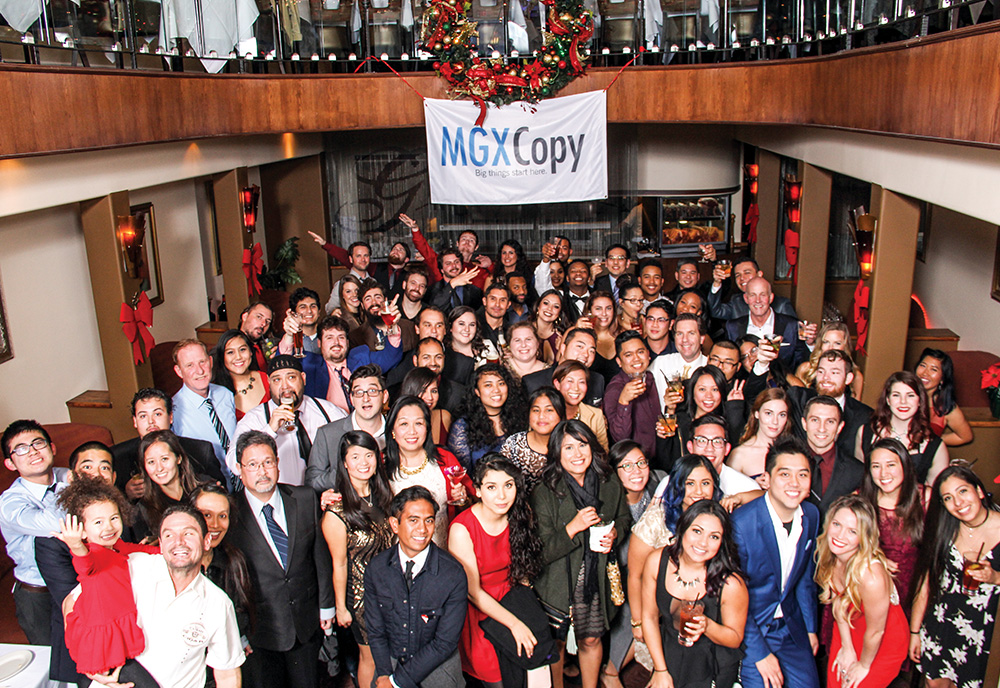
2016 – Add second facility, San Diego, 5,000 sq. ft. Holiday party.
For our customer service department, we use an online customer service tool called Salesforce Desk to track customer service inquiries. Since Salesforce Desk doesn’t have quite the reporting features we need, we port the data into an online reporting tool called Zoho. For each customer service employee, we track the number of calls, number of orders, number of completed orders, and the duration of each call. This allows us to measure each customer service representative’s performance.
To measure how specific products and services are selling, we use our custom MIS to capture information about the number of jobs by type of job (saddle-stitched booklets, perfect bound books, hardcover books, etc.) and every other aspect of production, such as matte vs. gloss lamination, and finishing options.
For overall operational efficiency, we record all shipments and costs in an Excel spreadsheet. We also capture where, geographically, our orders are going.
Understand the Data
Once we capture the data, whether it’s from a form or our MIS, we import it into an Excel spreadsheet where we can create “visualizations” — charts and graphs that let us see what’s going on in our business in a near real-time view.
To analyze our printing department, for example, we run a series of visualizations to track clicks, jobs, and errors per employee. We track each employee against other employees, as well as against department averages (see report, page 10).
“Once we capture the data, we create “visualizations” — charts and graphs that let us see what’s going on in our business in a near real-time view.”
Likewise, for our customer service department, we can see how each customer service representative is doing and how he or she compares to other reps. To track the performance of specific products and services, we plot two-week rolling averages to see the short- and long-term trends (see graph, page 11).
Act on What We Learn
These visualizations are the keys that turn data-for-data’s sake into information we can act on.
Looking at graphs of individuals and their productivity over time prompted us to develop and implement a standardized process for a six-month review period for every employee and a pay raise system based on whether or not certain goals have been met in the prior six months.
For our customer service department, we use the collected performance data to determine who might need more training. Issues we uncover — specific problems with orders, for example — serve as a basis for employee training topics.
2017 – Open third facility, New Jersey, 5,000 sq. ft. (17,500 sq. ft. total)
We ramp up or phase out products and services, or reallocate resources, based on the trends we see. If there’s been a huge increase in saddle-stitched books and orders are not getting out on time, we notice that quickly. We can track our late shipments for that product and then look at both the sales trends for the product as well as the production line. Is our equipment maxed out, or do we have extra capacity? If the former, then we need to add capacity. If the latter, we need to add an extra shift or add staff. The data tells us where we should be putting our resources. We can also identify those products or services for which we might want to scale back resources — or cease production (like, say, CD/DVD duplication services).
In terms of managing our equipment, we’re able to identify critical maintenance issues. For example, one of our 10 digital presses had started printing with a yellow tint. We were able to identify the exact machine and correct the color issue before it affected other projects.
Data analysis impacts our investment in facilities. We saw a few years ago that about 65 percent of our customers are located on the East Coast. We reasoned that if we opened an East Coast facility, it would cut our shipping costs and decrease our turnaround times. Since we’ve opened our facility in New Jersey, our shipping costs have dropped by over 30 percent per box, on average. And many of our Next-Day Air shipments haven turned into less expensive Ground shipments. We know this because we tracked it.
Amazon Speed Ahead
Collecting and analyzing all this data is really about understanding how to effectively allocate resources. It’s about constantly measuring the business’s vital signs and fixing small errors before they become big problems. If exceptions go unreported, if an operator keeps making the same mistakes, or if a machine keeps going down, we’d end up producing reprints (and eating into profits) without understanding and solving the underlying problems. This is especially true when you have a large fleet of equipment and a big staff.
Developing all of these tools and metrics is not a simple endeavor, and many print businesses don’t do it because owners and managers simply don’t have the time. The story is the same for us, so we created a full-time position for “data reporting.” This individual builds the processes to gather the data and creates the reports for the department managers. In our experience, dedicating a person to “owning” the data function in our business in invaluable.
Our data-centric approach has helped us improve the quality of the products we offer and increase turnaround times. We started out making black-and-white copies, then began offering color copies. We then expanded into brochures, and into saddle-stitching. We just started offering hardcover books and have been focusing heavily on wide-format applications such as banners and posters, which — the data tells us — have become big sellers and are on an upward trajectory. We’re also adding “embellishment” kinds of applications, such as business cards and postcards that feature a fifth color, raised ink, and foil.

MGX Copy encourages a positive and collaborative workplace by holding fun (and sometimes zany) team-building events.
We can turn jobs around very fast — at what we call “Amazon speed.” That is, we can get an order of 500 perfect bound books printed, bound, and delivered to a customer in under 24 hours. Based on this efficiency, we started marketing a service called “Rush Critical Overnight,” which has become very popular. Somebody calls us and says, “We messed up the name of the sponsor in our event program so we need to reprint the entire thing.” We can help them out. We’ll print and ship 100, 1,000, 2,000 copies of a catalog or program going anywhere in the country. We don’t see a lot of printers that are able to work at this kind of “Amazon speed.” Fluid data makes it possible.
As we enter 2019, MGX Copy is almost a decade old, and it amazes me how far we’ve come from simple black-and-white copies. And as a result, the name “MGX Copy” doesn’t fit us anymore. It makes us sound like a small copy shop when in reality we produce a wide variety of printed products. So starting in March 2019, we will be called Printivity.
It’s been an ongoing learning process since the early days in the garage — and the education never stops. The market for print is always changing, and demand for specific products is always changing. Back in 2010, it was copies. Today, it’s books and wide-format. Tomorrow? Who knows, but we’ll be there. The data will show us the way.
Lawrence Chou is CEO of MGX Copy, soon to be renamed Printivity. He founded the company in 2010 right out of college. If you do the math, the numbers say he is part of the Millennial generation. Despite the stereotype, he loves print. Connect via chou@leadingprint.org.
Other recent articles

The Vanishing
Shedding light on the declining number of graphic arts students…

Weighing In
Progressive print leaders discuss issues of the day…

We’re OK
Mental wellbeing as a cultural management strategy…

The Guide
Quantum Group helps marketers navigate the terrain…

By The Numbers
Print shipments and morale are up (infographic)…

Sizzle
Selling the value of print in a digital world…